
As investors, most of us are not chasing short-term highs. What truly matters is generating stable dividend income while aiming to outperform the broad market over the long term.
The latest 5-year backtest (April 2021 – April 2026) of Yield Spot, covering 70 high-dividend stocks from the US, Canada, UK, and Switzerland, shows encouraging results. Using a daily rebalancing weighting strategy, high-score stocks achieved an average α_BH (excess return over buy-and-hold the individual stock) of +6.5%. The best performers reached a Sharpe Ratio of 0.485, with maximum drawdown effectively controlled within -25%.
In this article, I break down all the key metrics — CAGR, Alpha, Sharpe Ratio, MaxDD, and win rate — in plain language, and share the Top 6 high-score quality stocks worth monitoring.
內容目錄
What is YieldSpot and Why It Matters for Dividend Investors?
YieldSpot is a quantitative backtesting tool designed specifically for high-dividend stocks. Its core logic is straightforward and practical, today I will show you one strategy :
- Every day, it calculates the real-time percentile ranking of dividend yields based on the past 3 years (756 trading days).
- When the percentile exceeds the threshold , gradually increase allocation to the stock.
- When below the threshold → gradually switch to SPY (or VOO).
- The main strategy uses daily weighting rebalancing (0%, 30%, 60%, 100% levels) for dynamic asset allocation.
This backtest fully accounts for adjusted close prices and after-tax dividend drag. Both the strategy and buy-and-hold benchmarks use the exact same period, making the alpha figures more reliable. For investors seeking stable cash flow with reduced single-stock risk, this approach offers a structured way to manage allocations dynamically.
Backtest Settings (Fully Transparent)
- Period: April 2021 – April 2026 (5 years, including high interest rate and volatile market conditions)
- Universe: 70 high-dividend stocks (primarily US, plus Canada, UK, Switzerland)
- Risk-free rate: 4.0%
- Transaction cost: 0.4% round-trip per rebalance
- Strategy: Daily percentile-based weighting rebalancing
- Win rate calculation: Non-overlapping 5-day windows (more conservative)
Core Results – Strategy 2 (Daily Weighting Rebalancing)
Overall statistics:
- Correlation between score and α_BH: r = +0.313 (p=0.008) — statistically significant, suggesting the scoring system has predictive power for excess returns.
- Average Sharpe Ratio: 0.222 (medium-to-upper range relative to buy-and-hold individual high-dividend stocks; top names reached 0.485)
- Average MaxDD (Maximum Drawdown): -31.5% (high-score group controlled within -25%)
- Average Win Rate: 55.7%
While the average Sharpe of 0.222 is not exceptionally high, this is a realistic 5-year test during a challenging high-rate environment. The real value lies in the combination of positive alpha and improved risk characteristics for higher-scoring stocks.
Top 10 α_BH Ranking
| Rank | Ticker | Score | α_BH | Strategy CAGR | Sharpe | MaxDD | Avg Holding % | Rebalances |
|---|---|---|---|---|---|---|---|---|
| 1 | TROW | 1.00 | +11.92% | +2.02% | 0.050 | -39.63% | 62.0% | 191 |
| 2 | MDT | 2.75 | +9.34% | +5.09% | 0.145 | -32.37% | 49.1% | 91 |
| 3 | AOS | 3.25 | +7.93% | +9.04% | 0.324 | -33.59% | 46.5% | 91 |
| 4 | APD | 1.00 | +7.92% | +10.51% | 0.401 | -25.15% | 49.1% | 98 |
| 5 | TGT | 2.25 | +6.60% | -1.38% | -0.037 | -50.21% | 67.7% | 65 |
| 6 | SYY | 4.75 | +6.51% | +6.83% | 0.233 | -31.13% | 46.7% | 186 |
| 7 | PPG | 3.25 | +6.48% | +1.77% | 0.032 | -32.01% | 66.6% | 101 |
| 8 | AMCR | 1.00 | +6.15% | +2.47% | 0.033 | -37.02% | 40.1% | 96 |
| 9 | KMB | 4.25 | +5.96% | +1.67% | -0.034 | -25.54% | 57.4% | 154 |
| 10 | V | 4.25 | +5.03% | +12.40% | 0.485 | -24.26% | 50.5% | 132 |
(Data source: YieldSpot backtest)
5 Key Metrics Every Investor Should Understand
- CAGR (Compound Annual Growth Rate) Measures the smoothed annual return if the strategy was run from start to end. Visa (V) reached +12.40%, slightly ahead of SPY’s buy-and-hold return of approximately +12.02% in the same period.
- α_BH (Alpha vs Buy & Hold the Stock) The most important metric here. Positive alpha means the strategy outperformed simply holding the stock. SYY delivered +6.51%, meaning the strategy added about 6.51% annual excess return on top of holding SYY itself.
- Sharpe Ratio Return per unit of risk (volatility). The average 0.222 is moderate, but top high-score names like V reached 0.485, close to SPY levels, indicating better risk-adjusted performance.
- MaxDD (Maximum Drawdown) The largest peak-to-trough decline. Average -31.5% is moderate risk overall, but the high-score group kept it within -25%, significantly better than many individual stocks that exceeded -40%. This helps with psychological resilience.
- Win Rate Percentage of non-overlapping 5-day periods with positive returns. Average 55.7% — modestly above 50%, with the edge compounding over time.
Top 6 High-Score Quality Stocks (Score ≥4.0 with Positive α_BH)
These names stand out for combining high scores, positive alpha, and defensive characteristics — suitable for long-term dividend-focused portfolios:
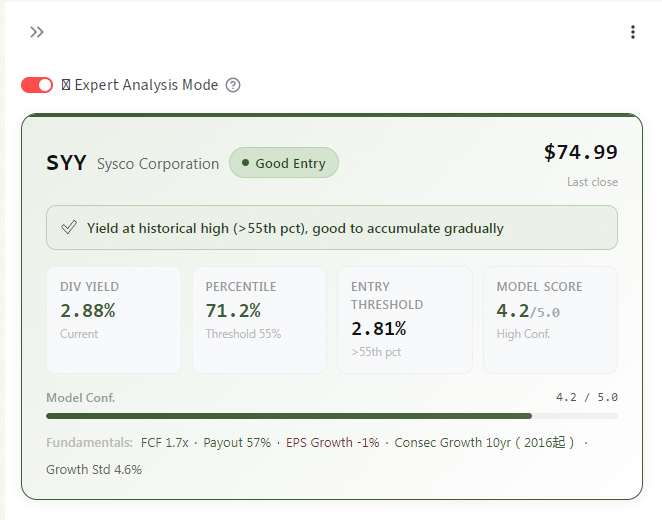
- SYY (Sysco): Score 4.75, α_BH +6.51%, Avg Holding 46.7% — Leading foodservice distributor with stable dividends.
- KMB (Kimberly-Clark): Score 4.25, α_BH +5.96% — Essential consumer staples, strong defensive qualities.
- V (Visa): Score 4.25, α_BH +5.03%, Sharpe 0.485 — Growth + dividend combination standout.
- NNN (National Retail Properties): Score 4.75, α_BH +3.85% — Retail REIT with reliable cash flows.
- SHW (Sherwin-Williams): Score 4.25, α_BH +2.18% — Paints leader with deep economic moat.
- MCD (McDonald’s): Score 4.75, α_BH +0.26% — Global brand powerhouse.
Final Thoughts: Master Dividend Yield Percentiles to Dramatically Cut Risk and Boost Returns
This 5-year backtest suggests that higher-scoring stocks (≥4.0) paired with daily rebalancing have a reasonable probability of outperforming pure buy-and-hold on the individual stock level, while helping manage drawdowns in a high-rate environment. The scoring system has shown statistically significant predictive ability across a 70-stock sample.
There is no perfect strategy in investing. The key is finding approaches that match your risk tolerance, time horizon, and goals. Yield Spot is not a black box—it’s an open, transparent tool you can verify for yourself. High-scoring stocks may not always be the biggest winners on the way up, but they are consistently the ones that offer the best combination of manageable risk and reliable income.
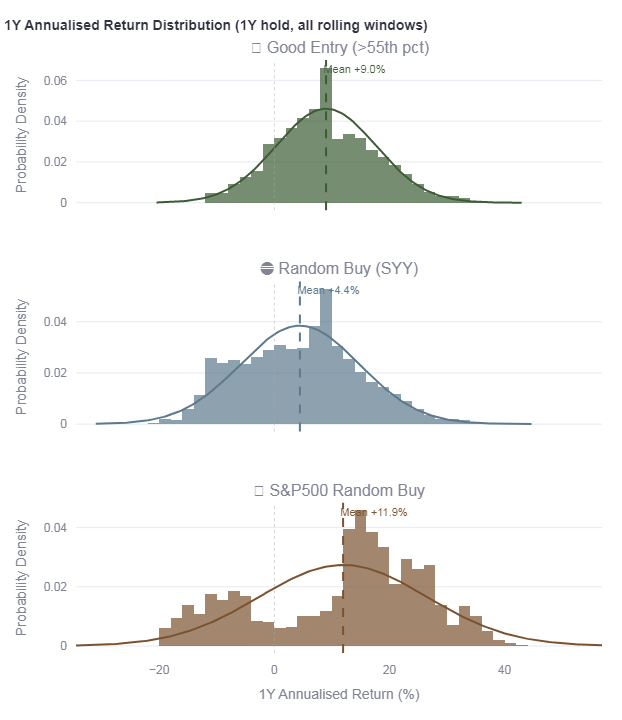
Even if you’re not a numbers person, you don’t need to run your own statistics. Simply check YieldSpot’s decision cards. Any stock showing yellow or green is already in the statistically proven sweet spot—giving you a significantly higher probability of capturing alpha from market mispricing. Want to see if the returns match your expectations? The annualized return chart tells the story in seconds.
Want to run your own tests? Visit the Yield Spot tool and input any US or other stock ticker. It generates a full report quickly.
Which stock would you like me to analyze further or run a longer 10-year backtest on? Feel free to leave a comment here.
To learn more about how dividend yield percentile analysis works, check out our full guide:
Dividend Yield Percentile Explained: A Data-Driven Way to Understand Dividend Yield History
Coca-Cola KO Stock — Is Now Really a Good Timing? What the Data Shows
Important Disclaimer: All data comes from Yield Spot backtests. Past performance does not guarantee future results. Investing involves risk of loss. Please conduct your own due diligence and consult a qualified advisor if needed. This article is for educational and informational purposes only and does not constitute investment advice.

「Charlie chacha,Excel VBA 愛好者、馬拉松跑者、
長線投資人。
🔧 目前在做:
📡 Yieldspot | 息率分位儀 <– 歡迎試用
— 幫存股族了解股息率歷史分位位置的分析工具」